
Evening is when education platforms are busiest. Learners study after school, parents check progress after work, and the batch jobs someone scheduled for "off-peak" run straight into it. If a system is going to fall over on a normal day, it does it around then.
When it does, the instinct is to blame the database. In three separate production incidents on the same stack, the database was never the problem. Once at 1,000 concurrent exam-takers it sat close to idle while the application serialised itself. The failures were all in the connection layer between the application and the database — the part nobody owns, that has three sets of limits which have to agree, and that has no dashboard by default.
Here are the three, with what each looked like from the outside.
The shape of the problem
Between your application and Postgres there are usually three separate limits, set by three different people, in three different files:
- The application pool (HikariCP, SQLAlchemy, whatever your framework uses) — how many connections one process will open.
- The pooler (PgBouncer) — how many client connections it accepts, and how many server connections it keeps.
- The database —
max_connections, and separately aCONNECTION LIMITon the role your app logs in as.
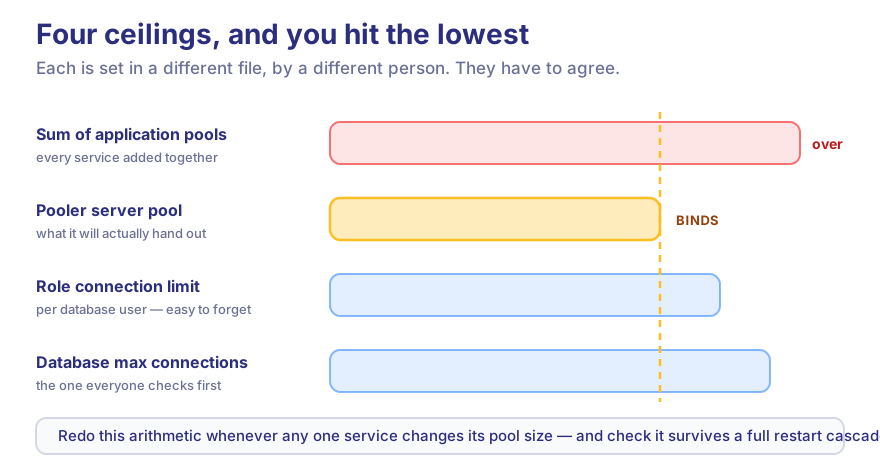
Every one of these is a ceiling, and you hit the lowest one. The failure is never labelled as such: what you see is slow requests, then timeouts, then errors from whichever part of the app happened to need a connection first.
Failure one: the budget that summed to more than the database allowed
The first was a straightforward saturation at peak. Two services started returning 500s, the application pools logged exhaustion timeouts, and the pooler began rejecting new clients.
The arithmetic was the whole story. Each service had a sensible-looking pool size. Nobody had added them up. The sum across all services exceeded what the pooler would hand out, so under load the services queued on acquiring a connection and then timed out waiting.
The detail worth carrying: the binding limit was not max_connections. It was the CONNECTION LIMIT on the database role the services authenticate as — a per-role cap that is easy to forget exists, and which produces exactly the same symptom as a global limit while being invisible to anyone checking max_connections.
What fixed it was lowering the per-service pools so the sum fit under the pooler's budget, and raising the pooler's client limit so a full restart cascade — every service reconnecting at once — could not exhaust it.
Write the budget down as one number. Sum of application pools ≤ pooler server pool ≤ role connection limit ≤ database max connections. When any service changes its pool size, that arithmetic has to be redone. Six services each tuning independently will always drift past it.
The restart cascade is the case people miss. Steady-state usage can look comfortable while a simultaneous restart of everything briefly demands several times that.
Failure two: a setting that leaked between services
This one is subtler and it cost real data.
A read-only diagnostic tool connected through the pooler and set two session-level parameters, one of which marked the session read-only. Reasonable-looking, and completely safe against a database directly.
The pooler runs in transaction pooling mode. In that mode a server connection returns to the pool between statements, not between sessions — so a session-level setting does not belong to your session. It stays on the server connection, and the next service handed that connection inherits it.
Which is what happened. A different service began failing every write with "cannot execute INSERT in a read-only transaction." Over roughly nine and a half minutes, 358 statements failed across three of four application pods. The fourth was unaffected, because it happened to hold connections that had never been contaminated — and that per-pod split is what proved this was leaked connection state rather than a database failover.
Two things made it worse than it should have been:
The failing writes were fire-and-forget. They recorded learner progress asynchronously, so there was no user-facing error and no retry. Nobody saw a 500. The data for that window is simply gone.
The reset that should have prevented it never ran. The pooler was configured with a reset query that discards session state — but that reset only runs in session pooling mode, or when explicitly forced to always run. In transaction mode with the default setting, it does not execute. A configuration line that looks like protection, and is not.
The fix during the incident was to tell the pooler to recycle its server connections, which closes them gracefully so clean ones open; errors stopped within about forty-five seconds. The rule that came out of it is the useful part:
-- Leaks through a transaction pooler. Never do this.
SET default_transaction_read_only = on;
SET statement_timeout = '90s';

-- Transaction-scoped. The pooler pins the server connection for the
-- transaction's duration, and the state is gone at rollback.
BEGIN;
SET TRANSACTION READ ONLY;
SET LOCAL statement_timeout = '90s';
-- ... your queries ...
ROLLBACK;
SET LOCAL and SET TRANSACTION are transaction-scoped; plain SET is not. Under transaction pooling that distinction is the difference between a safe query and a platform-wide incident.
Better still, where you can: make it a property of the role rather than the session. A genuinely read-only database user cannot leak read-only-ness onto anyone, because there is no session state involved.
Failure three: exhaustion that reported success
The third was on a Python service, and its worst property was that it did not look like a failure.
Several long-lived streaming responses were open at once while a background generation job ran, each row of which made its own retrieval call. Together they exhausted the pool. Each waiter blocked for the pool timeout — thirty seconds — and then died.
Three separate things turned that into silent data loss:
The deployed configuration was not the one in the repository. The code set a larger pool; the running image used the library's defaults, and no environment variable overrode it. The pool was less than half the size anyone believed. Check what the running process actually has, not what the config file says.
A synchronous database driver was being used from asynchronous code. Waiting on the pool blocked the event loop, so pool pressure did not just slow database work — it starved everything else the process was doing.
The failures logged as empty strings. The error handler interpolated the exception directly, and these exceptions stringify to nothing, so the logs filled with messages that had no message. The generation job then completed, persisted, and reported success — having produced zero of twenty items. The user received an empty result described as finished.
That last one is the real lesson, and it generalises well beyond pooling: a job that can produce nothing must not be able to report success. Assert on the output, not on the absence of a thrown exception. And log repr(e) with a stack trace rather than interpolating an exception into a string, or a whole class of failure becomes invisible.
Finding yours before it finds you
Four checks, in order of how much they usually turn up:
-
Add up the budget. All application pools summed, against the pooler's server pool, against the role's connection limit, against
max_connections. Write it in one place. Most teams doing this for the first time discover the sum already exceeds a ceiling and they have simply never had the simultaneous load to prove it. -
Find out which pooling mode you run. If it is transaction pooling, audit every session-level
SETin your application and tooling. This is agrep, and it is worth doing today. -
Compare deployed configuration to the repository. Not the file — the running process. Pool sizes are unusually prone to this because they are performance settings nobody checks until the incident.
-
Look for a synchronous driver inside asynchronous code. In Python particularly, this converts a database bottleneck into a whole-process one.
None of this is exotic, and none of it needs new tooling. It is the layer between two systems that both have owners, which is exactly why it goes unexamined until an evening when it doesn't.
We wrote about the same class of problem one level up — what breaks when a thousand students submit an exam at once — where again the infrastructure held and the application did not. Connection budgeting is one of the axes we score when evaluating a platform's peak-load behaviour in our LMS evaluation rubric.
Common questions
Should we use PgBouncer at all? If you run more than a couple of services against one Postgres, yes. Connections are expensive server-side and a pooler is the standard answer. Just adopt it deliberately — transaction pooling changes the semantics your application can rely on, and that is the part teams skip.
Transaction or session pooling?
Transaction pooling gives far better connection reuse and is usually right. It costs you session-level state: prepared statements, advisory locks, SET, LISTEN/NOTIFY. If you need those, either use session pooling for that specific path or redesign it to be transaction-scoped.
How big should the application pool be? Smaller than instinct suggests. Pool sizing is about how many queries can be in flight usefully, which is bounded by database cores, not by request concurrency — HikariCP's pool sizing guide is the clearest treatment of why, and its conclusions apply well beyond Java. A pool that is too large moves the queue from your application into the database, where it is harder to see and slower to recover.
What should we alert on? Clients waiting for a server connection at the pooler, and time spent acquiring a connection in the application. Both go bad well before user-visible errors, which makes them useful. Connection count alone tells you very little.
We are on a managed database. Does this still apply?
Yes. Managed services still have max_connections and per-role limits, and the application-side arithmetic is identical. What changes is that some of the ceilings are set by someone else, so you have to look them up rather than assume.
If your platform slows down at a predictable time of day and nobody can say which limit is binding, that is a short engagement with a specific answer. Talk to our team.